
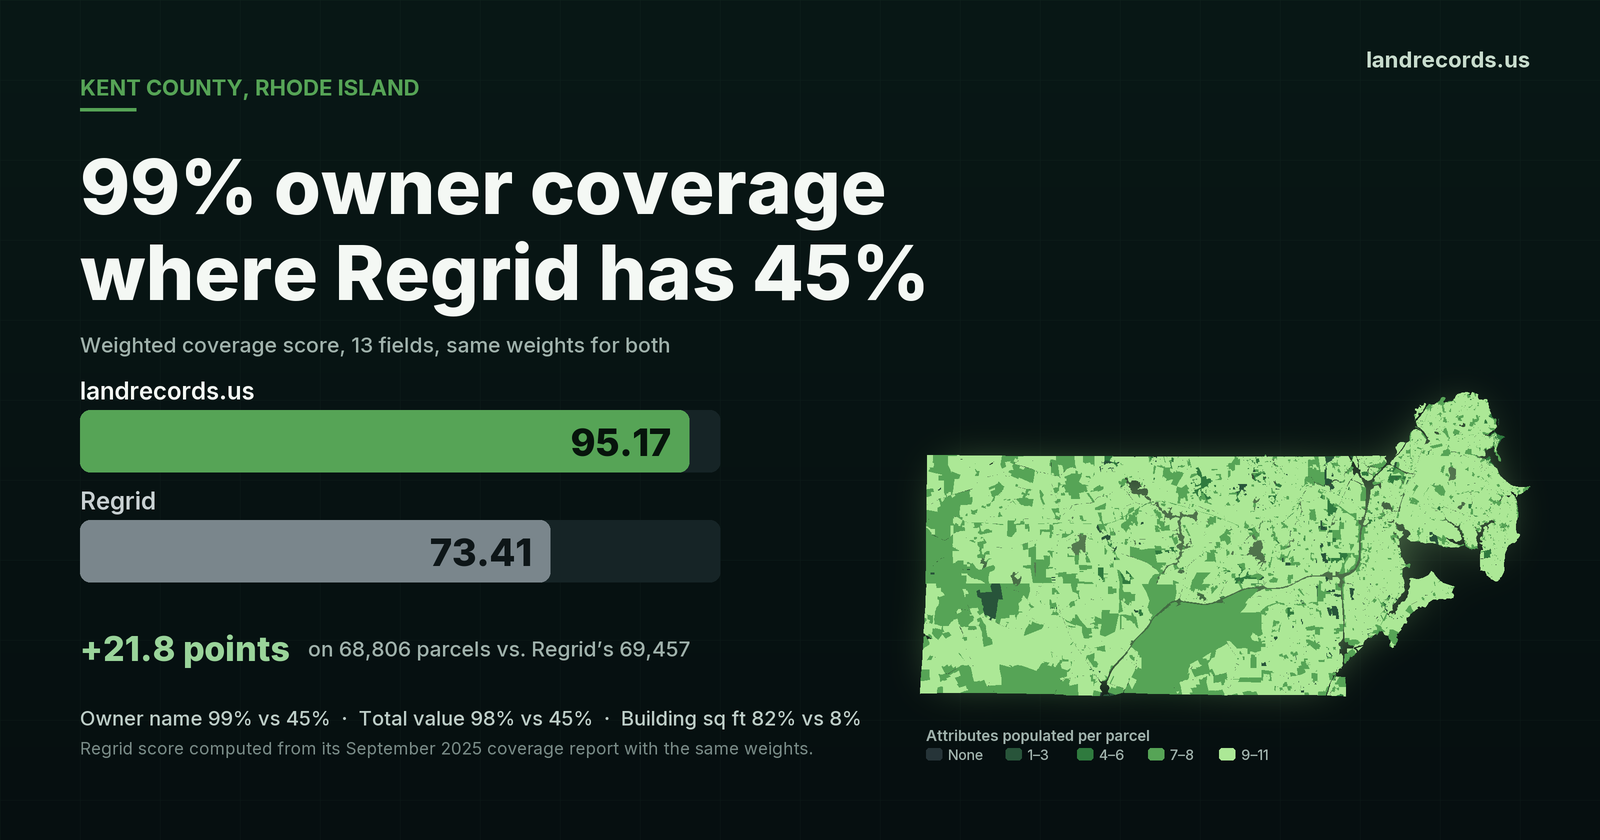
Kent County, Rhode Island has 68,806 parcels in our layer and 69,457 in Regrid’s September 2025 report. The parcel counts are within 1% of each other. What sits on those parcels is not. We carry an owner name on 99% of Kent’s parcels. Regrid’s report shows 45%. On the 13-field weighted score we use to rank every county, Kent reads 95.17 for us and 73.41 for Regrid.
Kent covers Warwick, Coventry, West Warwick, East Greenwich and West Greenwich, about 69,000 parcels in all. It is exactly the kind of county where the question is never just “where is the parcel.” It is who owns it, where to mail them, what the assessor says it is worth, and when it last sold.
What's the point of paying extra for "enhanced ownership" if you are missing half the data?
These are the weights we publish and use to score every county; they sum to 100. Regrid does not publish an aggregate score, so the 73.41 is our calculation from its own per-field coverage report, with parcel presence and geometry counted at 100% for both datasets.
| Attribute | Weight | landrecords.us | Regrid |
|---|---|---|---|
| Parcel record | 20 | 68,806 (99% of Regrid) | 69,457 |
| Geometry | 10 | 100% | 100% |
| Owner name | 15 | 99% | 45% |
| Parcel address | 10 | 100% | 88% |
| Owner mailing address | 5 | 97% | 45% |
| Total value | 8 | 98% | 45% |
| Land value | 4 | 98% | 45% |
| Use code | 7 | 100% | 83% |
| Zoning | 5 | 99% | 100% |
| Year built | 4 | 82% | 79% |
| Building square footage | 4 | 82% | 8% |
| Sale date | 4 | 94% | 72% |
| Sale amount | 4 | 60% | 76% |
| Weighted score | 100 | 95.17 | 73.41 |
Strip out parcel count and geometry, which both datasets have, and the 11 attributes a customer actually queries average 94.5% for us against 62.0% for Regrid.
What the gap looks like in records
Percentages hide scale, so here are the records. Our Kent layer carries an owner name on 68,166 parcels. At 45%, Regrid’s report implies about 31,300 on its 69,457. That is roughly 37,000 more parcels where you can see who owns the property.
- Owner mailing address: 66,842 parcels, against about 31,300.
- Total assessed value: 67,665 parcels, against about 31,300. The parcels we carry hold $30.3 billion in assessed value.
- Land value: 67,446 parcels, against about 31,300.
- Building square footage: 56,418 parcels, against about 5,600. That is a tenfold difference.
- Sale date: 64,350 parcels, against about 50,000.
- Use code: 68,644 parcels, against about 57,600.
For a lender, a title company, an appraiser, an investor or a municipality, those are not extras. A parcel with no owner and no value is a shape on a map. A parcel with both is a lead, a comp or a tax record you can use today.
Complete in every town, not just the big one
A county average can hide a weak town. Kent’s doesn’t. Every one of the five municipalities clears 97% on both owner name and total value:
| Town | Parcels | Owner name | Total value |
|---|---|---|---|
| Warwick | 37,999 | 99.4% | 98.6% |
| Coventry | 13,373 | 98.4% | 97.4% |
| West Warwick | 9,765 | 99.3% | 99.1% |
| East Greenwich | 4,964 | 98.0% | 97.6% |
| West Greenwich | 2,700 | 98.6% | 98.3% |
Our pipeline builds each town’s parcels from the records its own assessor publishes, then reconciles them into one county layer with a single schema. The result is the same fields, filled in the same way, from Warwick’s 38,000 parcels down to West Greenwich’s 2,700. (Five parcels near the county line are labelled with another town’s name, so the rows above total 68,801 of the county’s 68,806.)
The report also lists a LiDAR-derived building footprint at 87%. We don’t count that as building square footage, because it measures roof area, not the assessor’s living area. If you did count it, Regrid’s score would rise to 76.57, still 18.6 points below ours.
How the score is calculated
The score is a weighted average of 13 coverage percentages: parcel record (20), geometry (10), owner name (15), parcel address (10), owner mailing address (5), total value (8), land value (4), use code (7), zoning (5), year built (4), building square footage (4), sale date (4) and sale amount (4). Each attribute is scaled by parcel coverage and clamped at 100, so a county missing parcels cannot hide behind complete attributes. The same inputs are on Kent’s coverage page.
For Regrid we map the 11 attributes to the closest fields in its report: owner_pct, address_pct, mailadd_pct, parval_pct, landval_pct, usecode_pct, zoning_pct, yearbuilt_pct, sqft_pct, saledate_pct and saleprice_pct. Regrid’s Kent report is dated September 16, 2025, and our layer is measured today. Among the counties where our score is 90 or higher and Regrid’s report has been refreshed since June 2025, Kent has one of the widest gaps we have measured.
See Kent County for yourself
Kent’s datasets, vintages and per-field coverage are on its coverage page. Compare us on coverage, fields and price on our home page, or browse the US Nationwide Parcel Dataset. Email hello@landrecords.us: we’re happy to run this same analysis for any county you care about.